Data Fields
The Gantt Chart is driven entirely by the fields you drag into its wells. This page explains every field: what it does, whether it's required, how many columns it accepts, and how to shape your data for it.
Only three fields are required — Category, Start date, and End date. Everything else is optional and can be added in any combination.
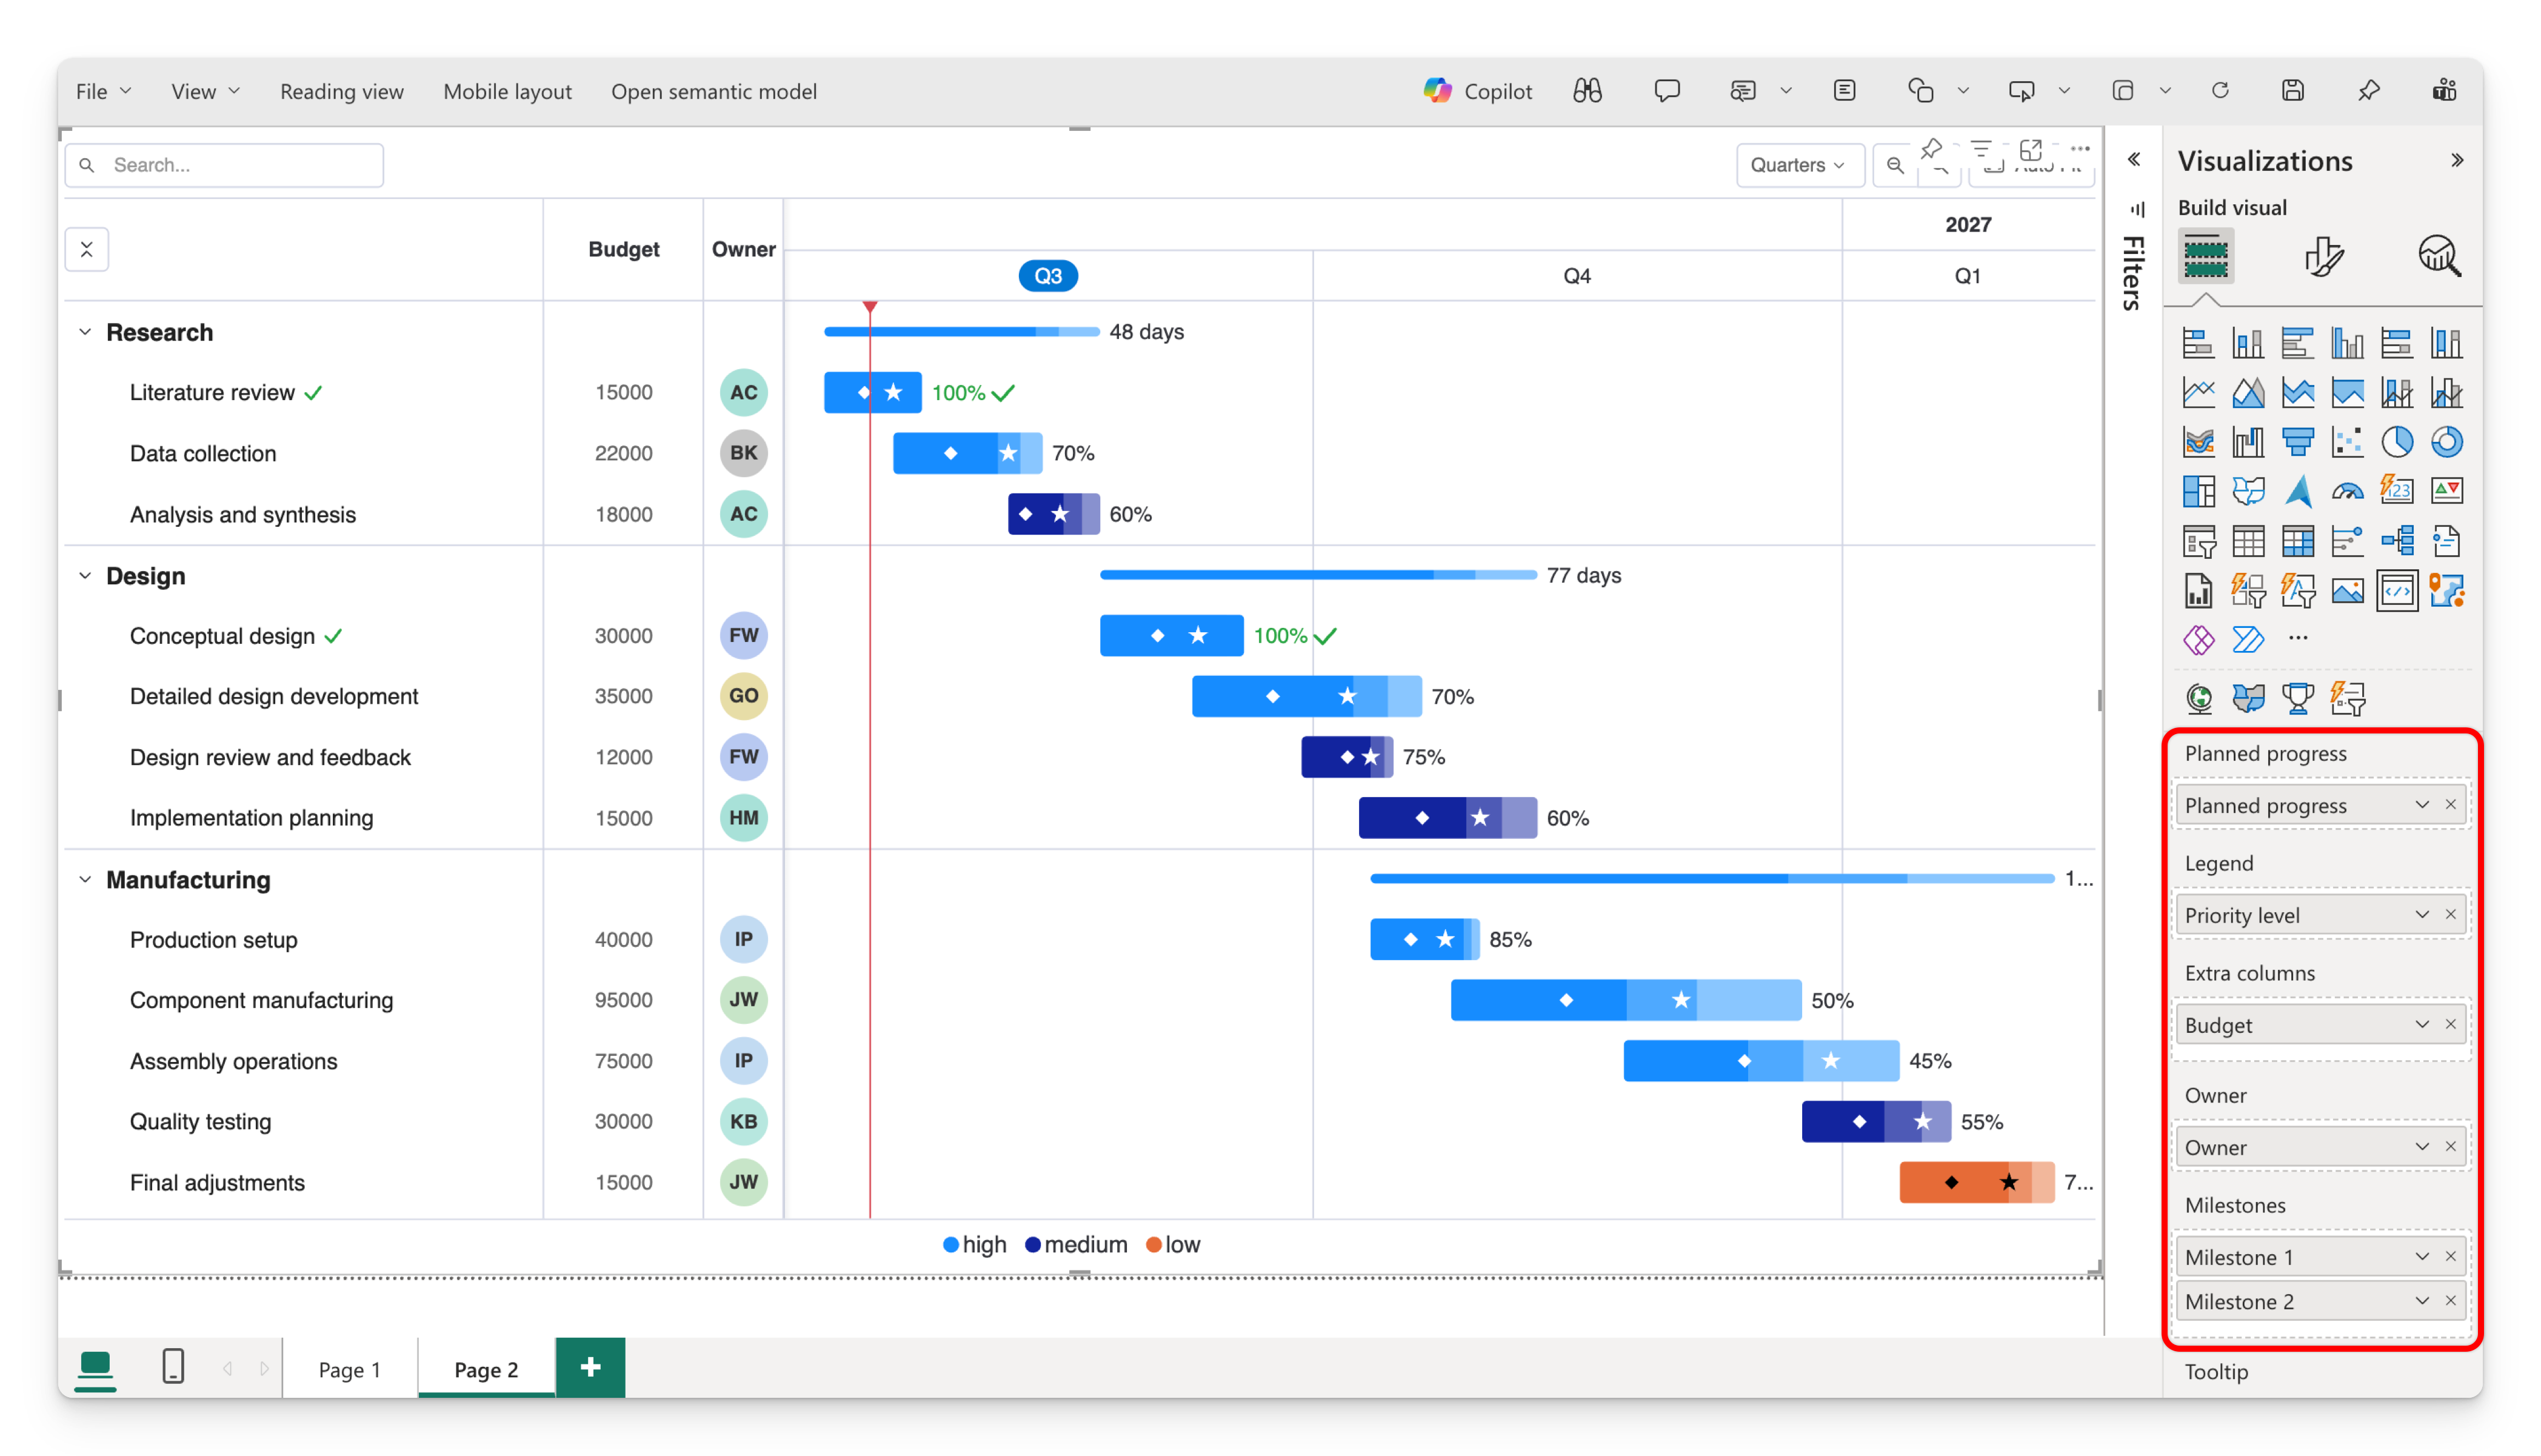
Field summary
| Field | Required? | Max columns | Purpose |
|---|---|---|---|
| Category | ✅ Yes | 10 | Task / sub-task hierarchy |
| Start date | ✅ Yes | 1 | Task start |
| End date | ✅ Yes | 1 | Task end |
| Progress bar | No | 1 | Actual % complete |
| Planned progress | No | 1 | Planned % complete |
| Legend | No | 1 | Color tasks by this field |
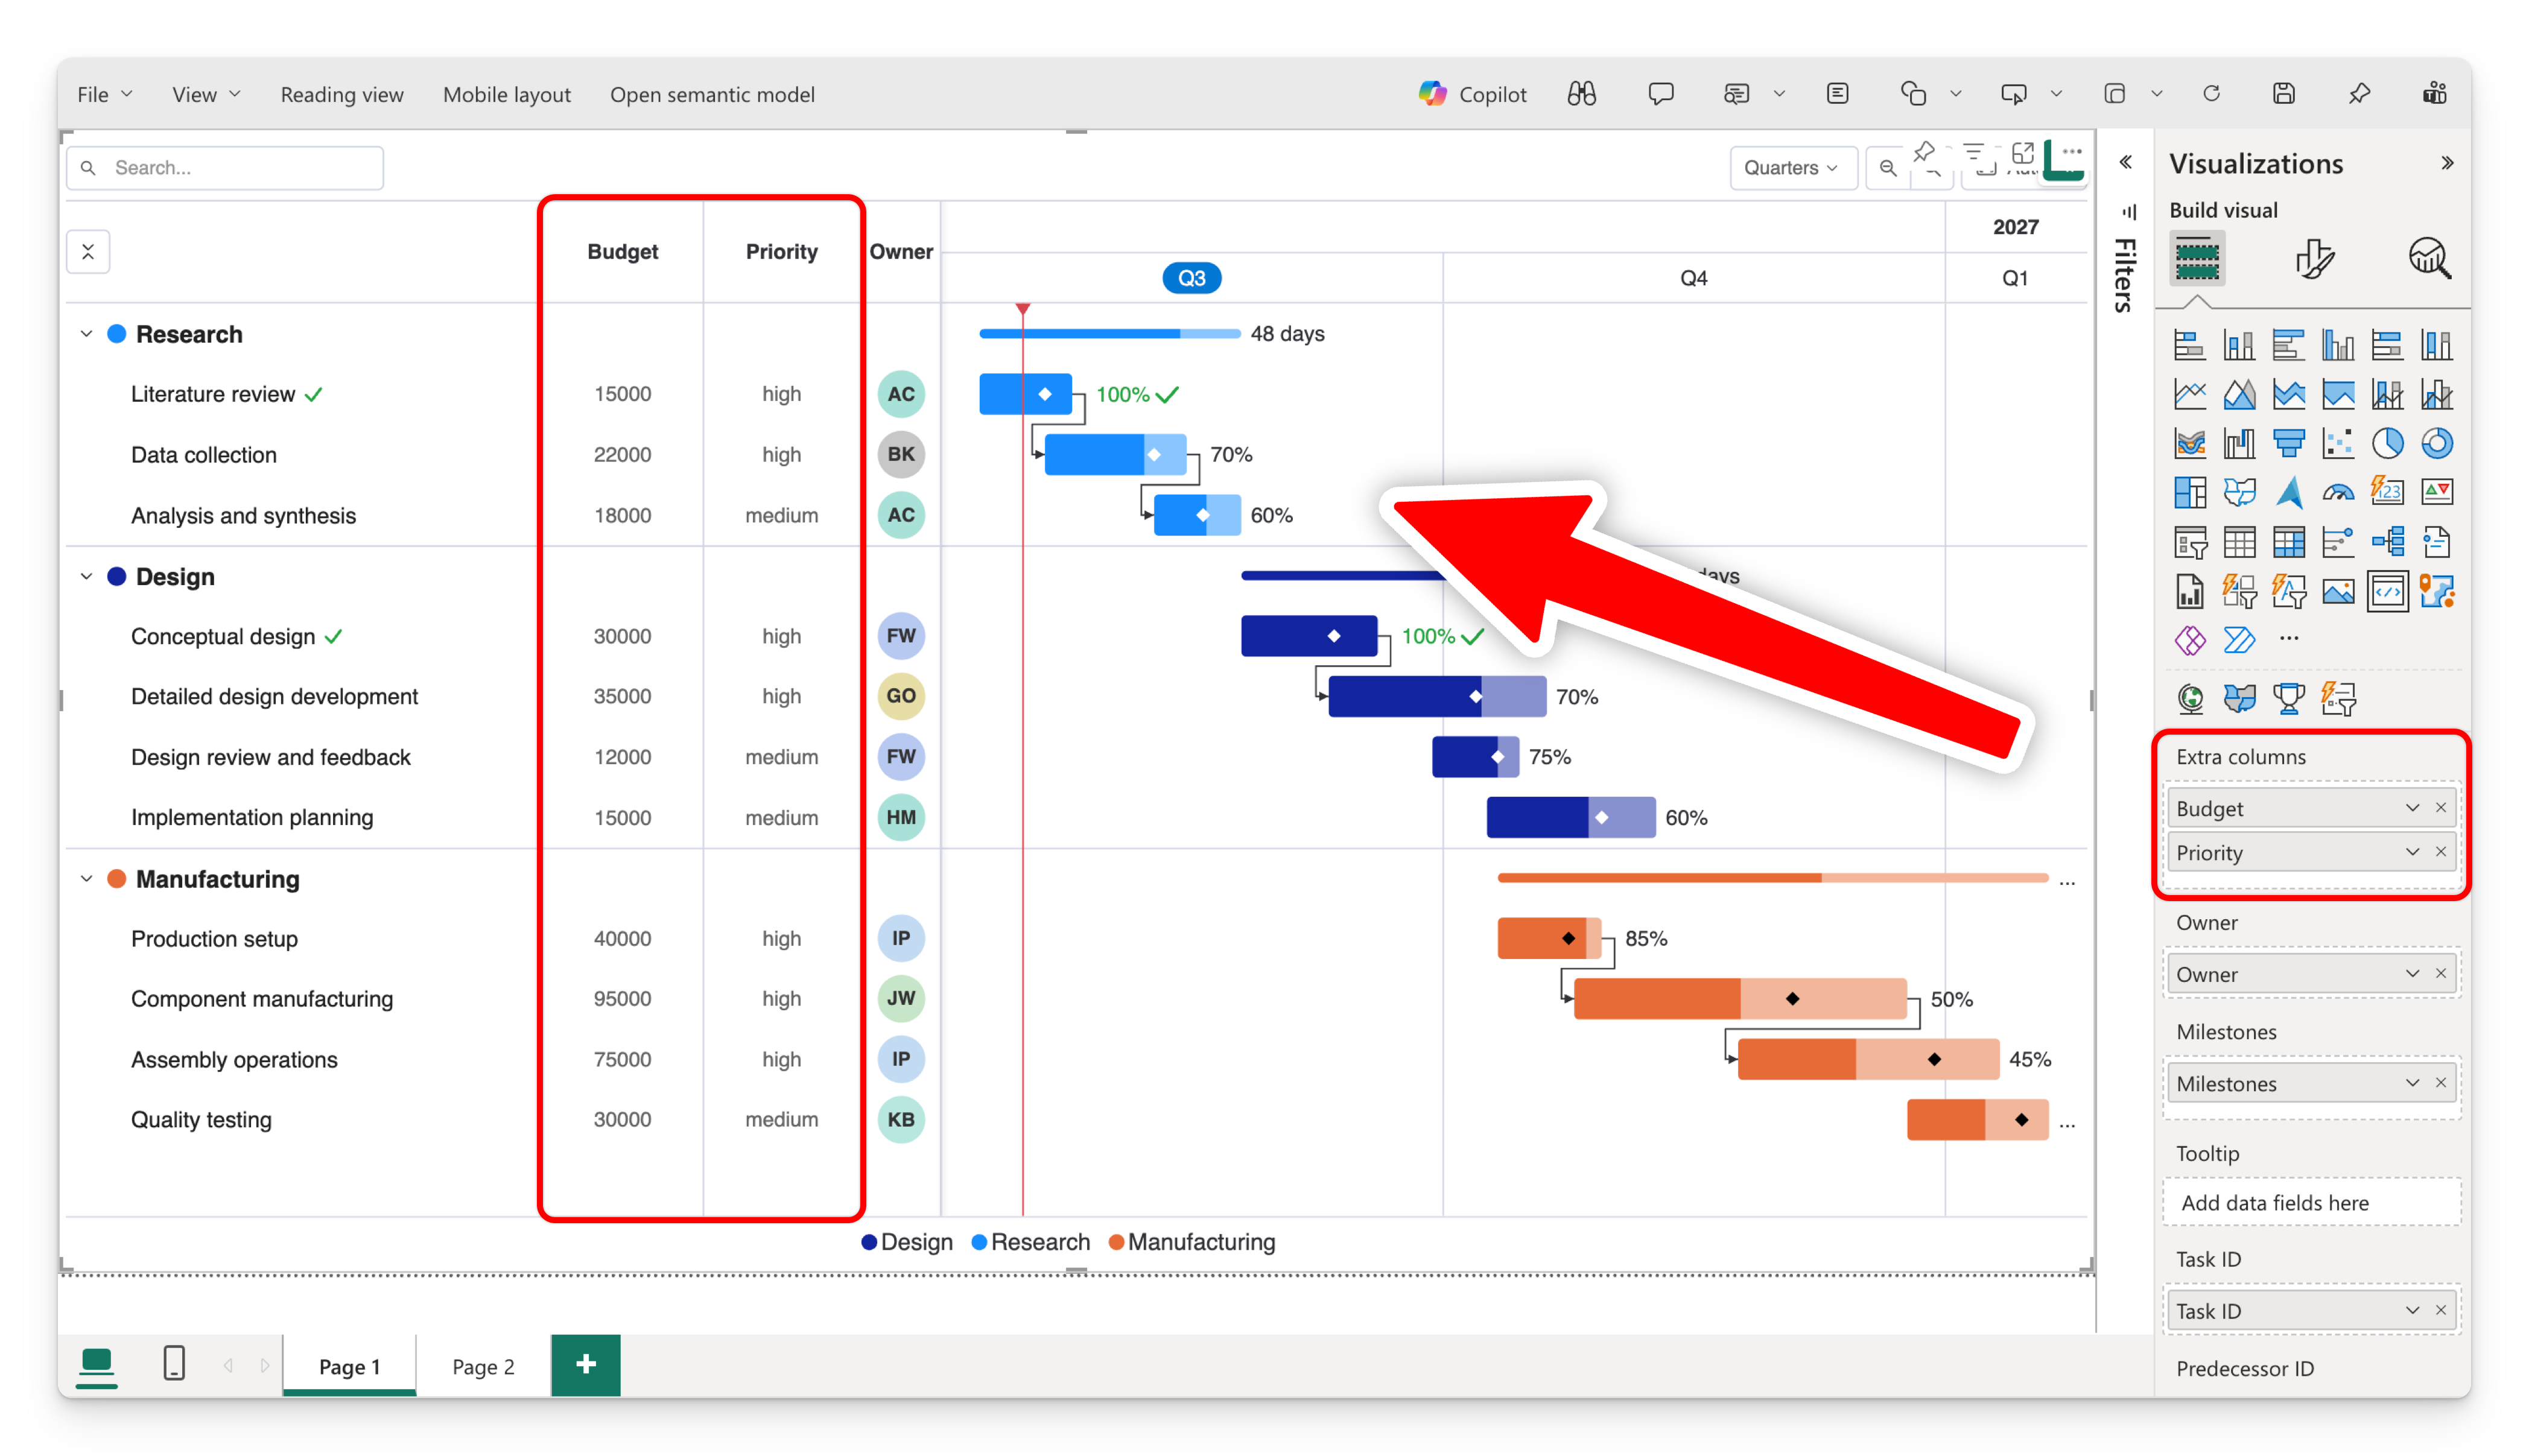
| Extra columns | No | 3 | Extra data columns beside the task list |
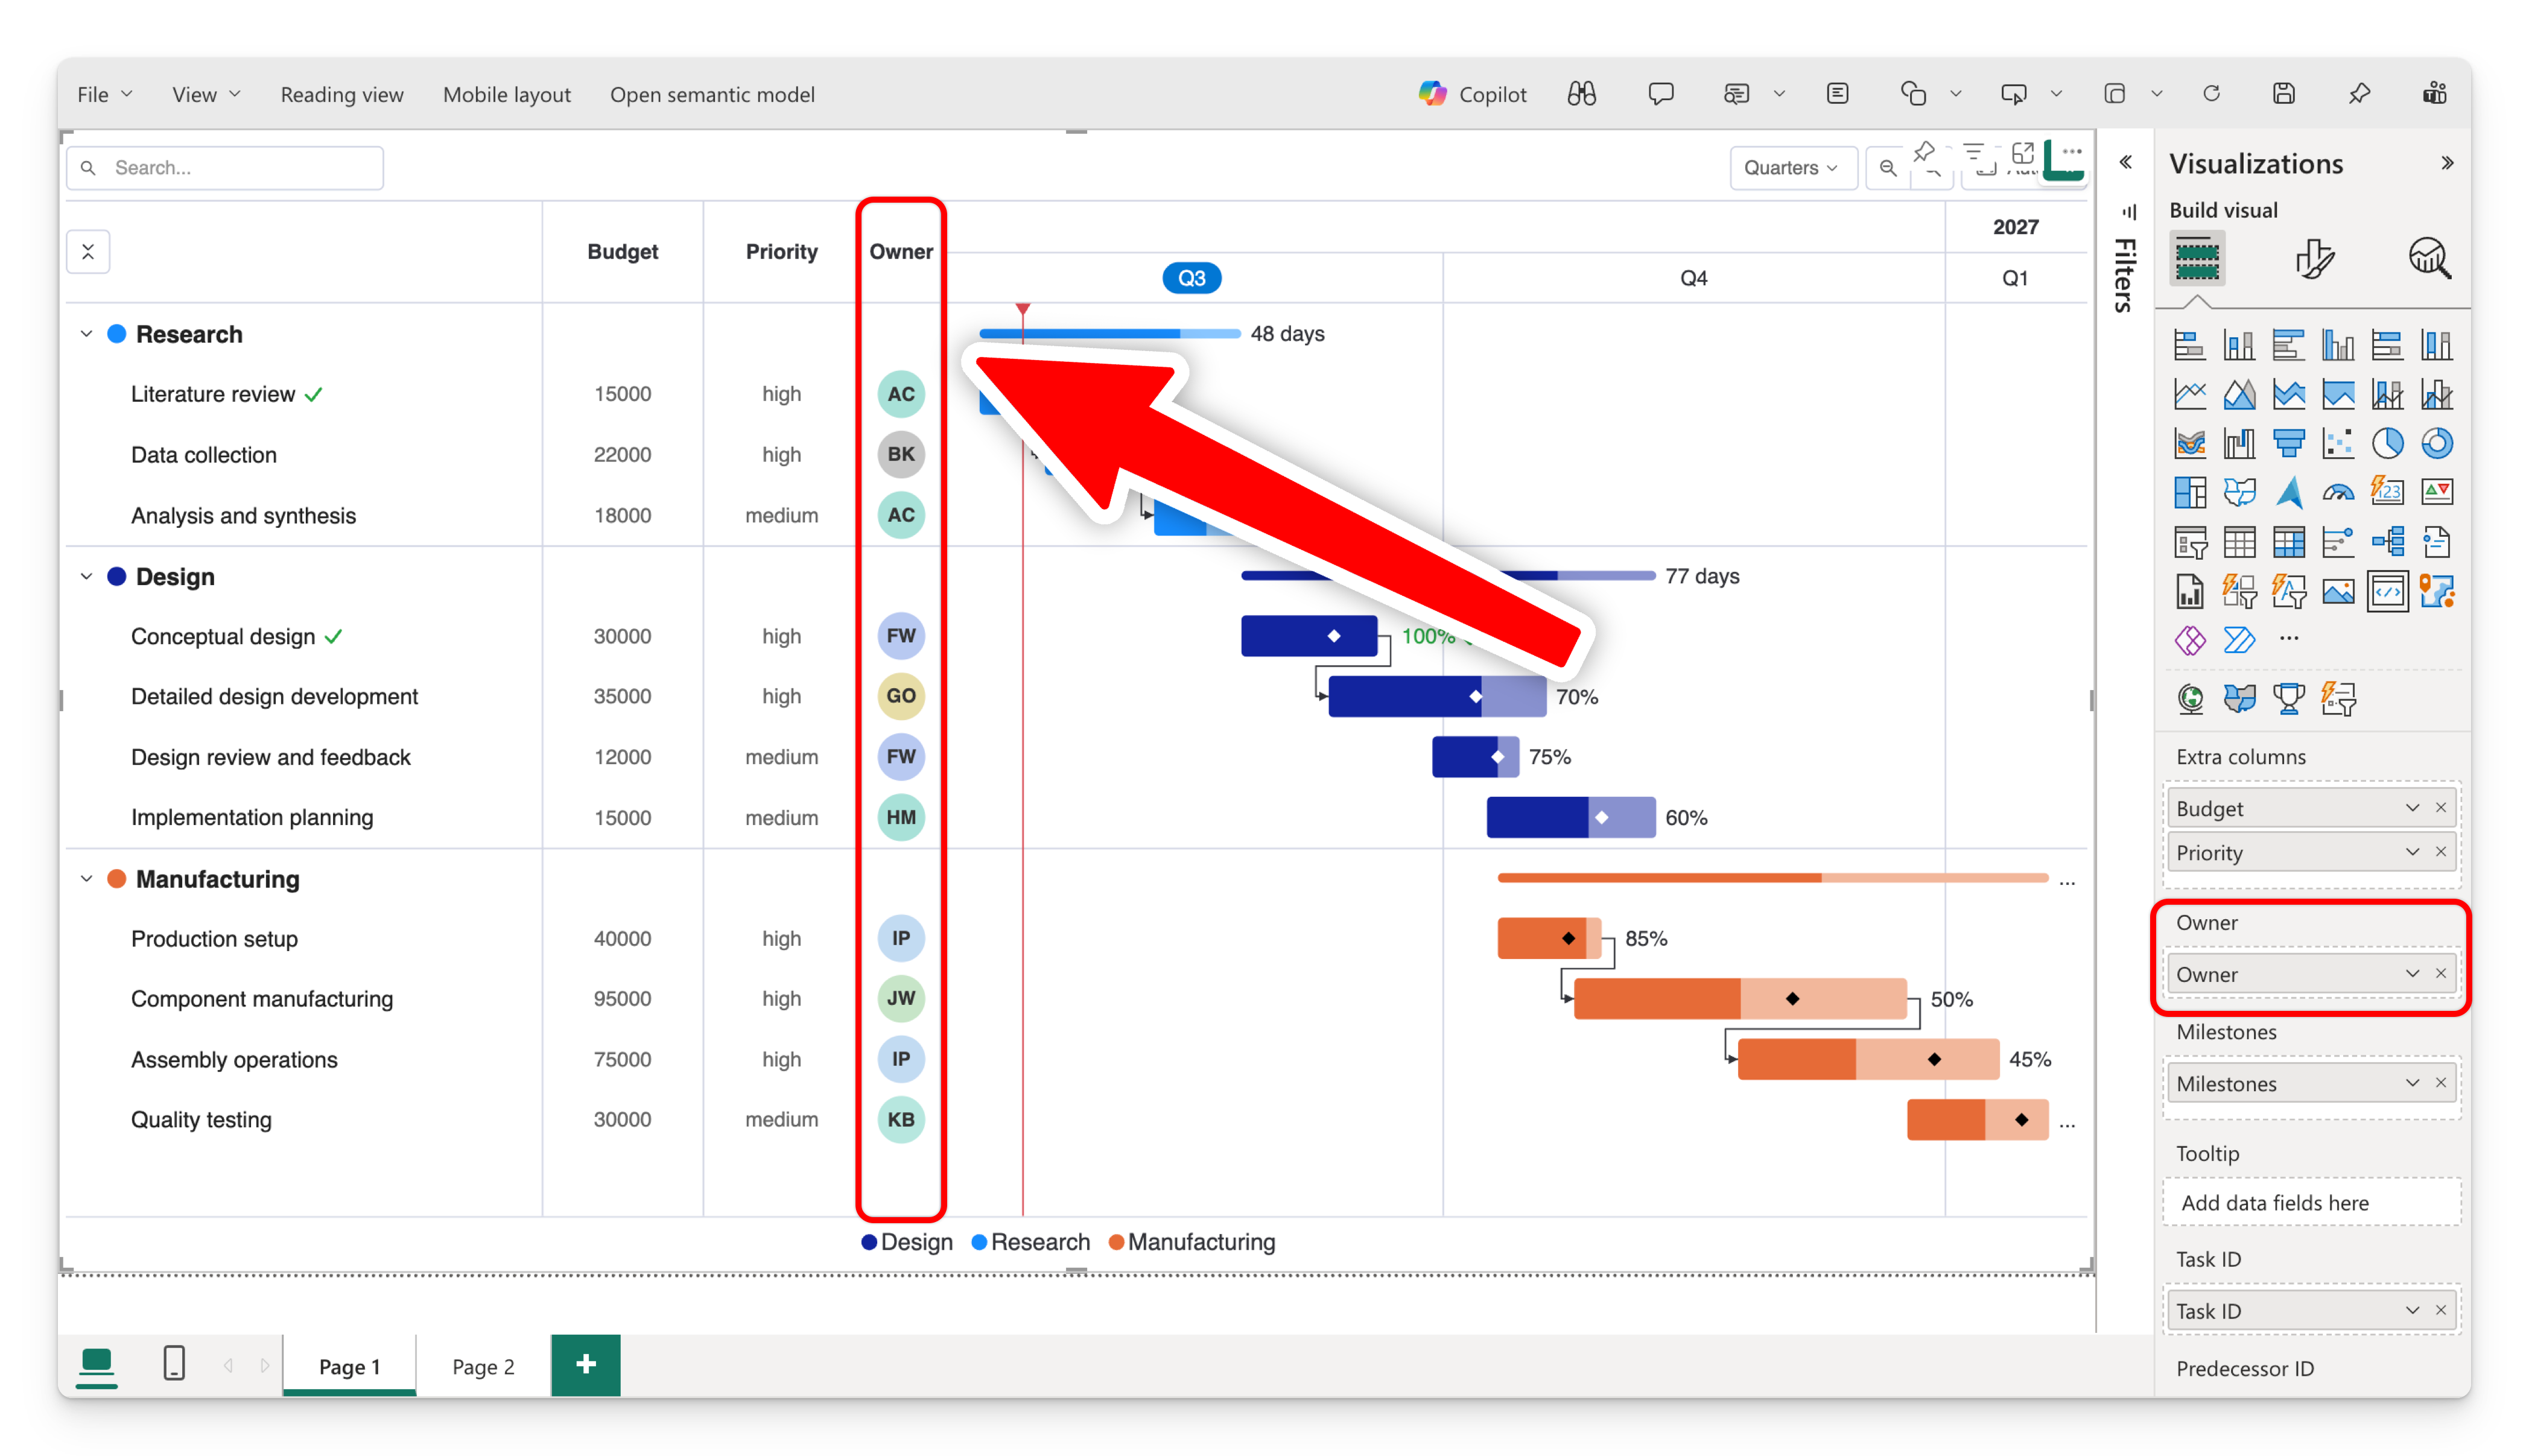
| Owner | No | 1 | Owner initials in a circle |
| Task milestones | No | 5 | Date columns shown as markers |
| Tooltip | No | 4 | Extra fields on hover |
| Task ID | No | 1 | Unique task identifier |
| Predecessor ID | No | 1 | Tasks this task depends on |
Category (the task hierarchy)
Required · up to 10 columns · grouping field
Category defines the rows of your chart and their nesting. Each column you add is one level of the hierarchy, from left (top level) to right (deepest level):
- One column → a flat list of tasks.
- Two columns → projects (level 1) with tasks nested underneath (level 2).
- Up to ten columns → deep project → phase → task → sub-task structures.
Parent rows automatically become summary bars that span all of their children, and each parent can be expanded or collapsed in the task list.
| Project | Task |
|---|---|
| Website relaunch | Discovery |
| Website relaunch | Design |
| Marketing | Campaign brief |
In this example, "Website relaunch" and "Marketing" are top-level summary rows; the tasks nest beneath them.
Order your Category columns from broadest to most specific. The first column is always the outermost group.
Parent rows roll up automatically — a parent's bar spans the earliest start and latest end of its children, and its progress is the rolled-up progress of those children.
Start date & End date
Required · 1 column each · measures
These set where each task bar begins and ends on the timeline. Both must be a Date or Date/Time type in your model. A task with a start but no end (or vice-versa) can't be drawn, so make sure every task row has both.
If your dates arrive as text, convert them to a date type in Power Query or the model before assigning them here.
Progress bar
Optional · 1 column · measure · values 0–100
A measure representing how complete each task is, as a percentage from 0 to 100. The value fills the task bar so you can see progress at a glance. You can choose how the fill looks (a strip or an overlay) and whether the percentage is shown as a label — see Progress, colors & appearance.
Planned progress
Optional · 1 column · measure · values 0–100
A second percentage (0–100) representing where a task should be. When supplied alongside Progress bar, the chart can show planned vs. actual so you can spot tasks that are ahead of or behind plan.
Legend
Optional · 1 column · measure
The field used to color the task bars. For example, color by Status, Team, or Phase. When a Legend field is present, each distinct value gets its own color (which you can override), and a legend can be shown around the chart.
Extra columns
Optional · up to 3 columns · measures
Up to three additional data columns displayed between the task list and the timeline — useful for showing values like effort, budget, or a status code next to each task.
Owner
Optional · 1 column · measure
The task owner's name. The visual shows it as initials inside a colored circle on each row, with a consistent color per owner. Great for seeing who's responsible without widening the task list.
Task milestones
Optional · up to 5 columns · measures (dates)
One to five date columns, each plotted as a marker on the task's row. Use them for key dates such as kickoff, review, or go-live. Each milestone column can have its own marker symbol (circle, diamond, square, triangle, or star) and you can control marker size and whether markers outside a bar are hidden — see Milestones.
Tooltip
Optional · up to 4 columns · measures
Extra fields shown in the hover tooltip when someone points at a task bar, on top of the built-in details. Use it to surface context (owner, budget, notes) without cluttering the chart. The visual also supports Power BI report page tooltips.
Task ID & Predecessor ID
Optional · 1 column each · measures · required for dependency arrows
These two fields work together to draw dependency arrows between tasks:
- Task ID — a unique identifier for each task (e.g.
1,2,A10). - Predecessor ID — the ID(s) of the task(s) a given task depends on. Multiple predecessors are separated by commas or semicolons (e.g.
1,2or3;4).
| Task ID | Task | Predecessor ID |
|---|---|---|
| 1 | Discovery | |
| 2 | Design | 1 |
| 3 | Build | 2 |
| 4 | Launch | 3 |
Full setup and styling is covered in Dependencies.
Task IDs must be unique. If two tasks share an ID, the arrows can't resolve which task a predecessor refers to.
Next steps
- Timeline & navigation — control the time scale and starting view.
- Tasks, milestones & dependencies — hierarchy, sorting, milestones, and arrows.
- Progress, colors & appearance — styling and layout.